Portfolio Occupancy
Portfolio Occupancy
Period Ending October 2026
- Period Ending October 2026
- Period Ending April 2026
- Period Ending October 2025
- Period Ending April 2025
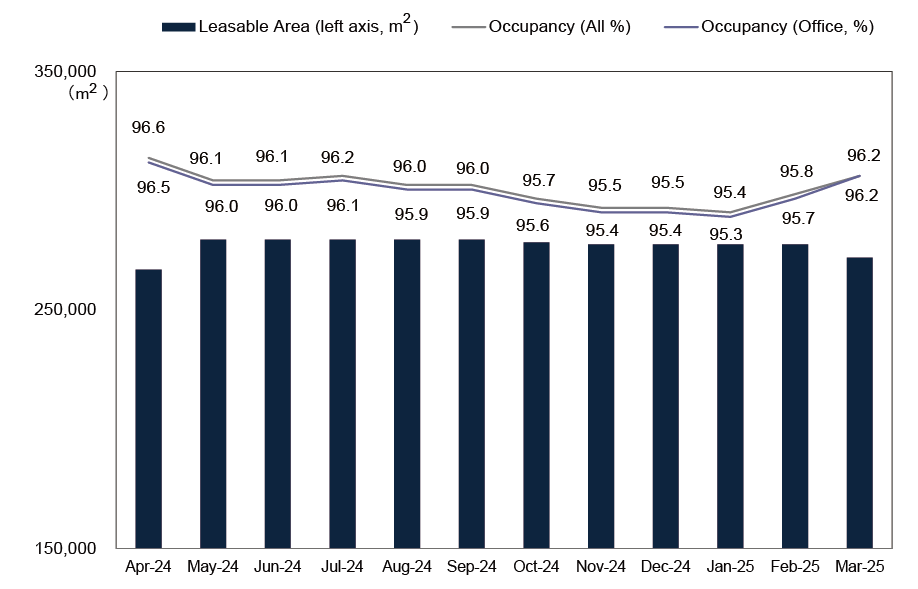
- Period Ending October 2024
- Period Ending April 2024
- Period Ending October 2023
- Period Ending April 2023
- Period Ending October 2022
- Period Ending April 2022
- Period Ending October 2021
- Period Ending April 2021
- Period Ending October 2020
- Period Ending April 2020
- Period Ending October 2019
- Period Ending April 2019
- Period Ending October 2018
- Period Ending April 2018
- Period Ending October 2017
- Period Ending April 2017
- Period Ending October 2016
- Period Ending April 2016
- Period Ending October 2015
- Period Ending April 2015
- Period Ending October 2014
- Period Ending April 2014
- Period Ending October 2013
- Period Ending April 2013
- Period Ending October 2012
- Period Ending April 2012
This table can be scrolled horizontally.
| By Asset Type | By Area | No. Of Assets | No. Of Tenants | Leasable Area (m²) |
Leased Area (m²) |
||||||
|---|---|---|---|---|---|---|---|---|---|---|---|
| Total | Office (O) | Other (Z) | Central Tokyo | Tokyo Metropolitan Area | Four Major Regional Cities | Other Regional Cities | |||||
| May-26 | 97.3% | 97.2% | 100.0% | 97.5% | 97.0% | 96.3% | 99.6% | 87 | 1,033 | 260,145.57 | 253,028.29 |
| Jun-26 | 97.3% | 97.3% | 100.0% | 97.5% | 97.7% | 95.6% | 99.6% | 87 | 1,032 | 260,100.00 | 253,100.00 |
This table can be scrolled horizontally.
| By Asset Type | By Area | No. Of Assets | No. Of Tenants | Leasable Area (m²) |
Leased Area (m²) |
||||||
|---|---|---|---|---|---|---|---|---|---|---|---|
| Total | Office (O) | Other (Z) | Central Tokyo | Tokyo Metropolitan Area | Four Major Regional Cities | Other Regional Cities | |||||
| Nov-25 | 97.3% | 97.2% | 100.0% | 97.0% | 98.5% | 95.6% | 99.6% | 85 | 1,001 | 253,777.62 | 246,804.43 |
| Dec-25 | 97.1% | 97.0% | 100.0% | 96.6% | 98.3% | 95.9% | 99.6% | 86 | 1,009 | 256,040.52 | 248,522.03 |
| Jan-26 | 97.0% | 96.9% | 100.0% | 97.1% | 97.1% | 95.7% | 99.6% | 86 | 1,012 | 256,033.27 | 248,292.23 |
| Feb-26 | 97.1% | 97.0% | 100.0% | 97.1% | 97.2% | 96.0% | 99.6% | 87 | 1,033 | 260,145.46 | 252,520.91 |
| Mar-26 | 96.9% | 96.9% | 100.0% | 96.3% | 97.5% | 96.5% | 99.6% | 87 | 1,030 | 260,145.46 | 252,061.83 |
| Apr-26 | 97.3% | 97.3% | 100.0% | 97.2% | 97.4% | 96.9% | 99.6% | 87 | 1,036 | 260,159.70 | 253,257.96 |
| By Asset Type | By Area | No. Of Assets | No. Of Tenants | Leasable Area (m²) |
Leased Area (m²) |
||||||
|---|---|---|---|---|---|---|---|---|---|---|---|
| Total | Office (O) | Other (Z) | Central Tokyo | Tokyo Metropolitan Area | Four Major Regional Cities | Other Regional Cities | |||||
| May-25 | 95.7% | 95.7% | 100.0% | 94.8% | 98.3% | 93.5% | 98.2% | 87 | 1,025 | 265,842.94 | 254,481.96 |
| Jun-25 | 96.2% | 96.2% | 100.0% | 95.9% | 98.3% | 93.3% | 98.2% | 87 | 1,026 | 265,854.91 | 255,758.12 |
| Jul-25 | 96.4% | 96.3% | 100.0% | 96.3% | 98.5% | 93.3% | 98.2% | 87 | 1,028 | 265,855.10 | 256,252.29 |
| Aug-25 | 97.1% | 97.0% | 100.0% | 97.1% | 98.5% | 94.4% | 99.0% | 87 | 1,031 | 265,915.79 | 258,130.63 |
| Sep-25 | 97.2% | 97.2% | 100.0% | 97.5% | 98.7% | 94.0% | 99.0% | 87 | 1,034 | 265,957.82 | 258,515.36 |
| Oct-25 | 97.5% | 97.5% | 100.0% | 97.6% | 98.5% | 95.6% | 99.6% | 86 | 1,026 | 257,311.24 | 250,999.12 |
| By Asset Type | By Area | No. Of Assets | No. Of Tenants | Leasable Area (m²) |
Leased Area (m²) |
||||||
|---|---|---|---|---|---|---|---|---|---|---|---|
| Total | Office (O) | Other (Z) | Central Tokyo | Tokyo Metropolitan Area | Four Major Regional Cities | Other Regional Cities | |||||
| Nov-24 | 95.5% | 95.4% | 100.0% | 93.5% | 97.9% | 94.7% | 99.1% | 91 | 1,058 | 277,511.46 | 264,921.94 |
| Dec-24 | 95.5% | 95.4% | 100.0% | 94.1% | 97.2% | 94.5% | 99.1% | 91 | 1,057 | 277,511.46 | 265,023.67 |
| Jan-25 | 95.4% | 95.3% | 100.0% | 94.2% | 97.7% | 93.7% | 98.7% | 91 | 1,054 | 277,511.46 | 264,786.18 |
| Feb-25 | 95.8% | 95.7% | 100.0% | 94.4% | 98.7% | 94.1% | 98.7% | 91 | 1,061 | 277,511.54 | 265,895.42 |
| Mar-25 | 96.1% | 96.1% | 100.0% | 95.0% | 99.2% | 94.1% | 98.6% | 88 | 1,052 | 271,991.61 | 261,508.92 |
| Apr-25 | 96.2% | 96.1% | 100.0% | 95.2% | 99.2% | 93.9% | 97.8% | 87 | 1,025 | 265,842.94 | 255,614.46 |
| By Asset Type | By Area | No. Of Assets | No. Of Tenants | Leasable Area (m²) |
Leased Area (m²) |
||||||
|---|---|---|---|---|---|---|---|---|---|---|---|
| Total | Office (O) | Other (Z) | Central Tokyo | Tokyo Metropolitan Area | Four Major Regional Cities | Other Regional Cities | |||||
| May-24 | 96.1% | 96.0% | 100.0% | 95.0% | 97.1% | 95.4% | 99.3% | 93 | 1,067 | 279,504.84 | 268,616.17 |
| Jun-24 | 96.1% | 96.0% | 100.0% | 94.9% | 97.0% | 95.4% | 99.3% | 93 | 1,065 | 279,504.84 | 268,466.08 |
| Jul-24 | 96.2% | 96.1% | 100.0% | 94.8% | 96.8% | 96.5% | 99.3% | 93 | 1,066 | 279,503.91 | 268,800.12 |
| Aug-24 | 96.0% | 95.9% | 100.0% | 94.1% | 97.2% | 96.5% | 99.3% | 93 | 1,067 | 279,515.22 | 268,246.28 |
| Sep-24 | 96.0% | 95.9% | 100.0% | 93.7% | 97.6% | 96.8% | 99.3% | 93 | 1,069 | 279,549.67 | 268,247.70 |
| Oct-24 | 95.7% | 95.6% | 100.0% | 93.8% | 97.9% | 95.2% | 99.3% | 92 | 1,071 | 278,292.10 | 266,325.92 |
| By Asset Type | By Area | No. Of Assets | No. Of Tenants | Leasable Area (m²) |
Leased Area (m²) |
||||||
|---|---|---|---|---|---|---|---|---|---|---|---|
| Total | Office (O) | Other (Z) | Central Tokyo | Tokyo Metropolitan Area | Four Major Regional Cities | Other Regional Cities | |||||
| Nov-23 | 96.4% | 96.3% | 100.0% | 95.8% | 95.1% | 97.1% | 99.1% | 88 | 1,007 | 269,114.17 | 259,468.33 |
| Dec-23 | 95.3% | 95.2% | 100.0% | 93.6% | 94.8% | 97.1% | 99.1% | 88 | 1,005 | 269,106.96 | 256,492.09 |
| Jan-24 | 94.9% | 94.8% | 100.0% | 92.3% | 95.4% | 97.0% | 99.1% | 88 | 1,005 | 269,106.96 | 255,333.30 |
| Feb-24 | 95.4% | 95.3% | 100.0% | 93.1% | 95.8% | 97.3% | 99.3% | 88 | 1,010 | 269,106.96 | 256,824.20 |
| Mar-24 | 95.7% | 95.5% | 100.0% | 93.4% | 96.6% | 97.0% | 99.3% | 88 | 1,010 | 269,108.19 | 257,412.41 |
| Apr-24 | 96.6% | 96.5% | 100.0% | 94.9% | 98.0% | 97.0% | 99.3% | 87 | 1,006 | 266,944.42 | 257,879.22 |
| By Asset Type | By Area | No. Of Assets | No. Of Tenants | Leasable Area (m²) |
Leased Area (m²) |
||||||
|---|---|---|---|---|---|---|---|---|---|---|---|
| Total | Office (O) | Other (Z) | Central Tokyo | Tokyo Metropolitan Area | Four Major Regional Cities | Other Regional Cities | |||||
| May-23 | 96.0% | 96.1% | 94.4% | 95.7% | 94.1% | 96.5% | 100.0% | 88 | 1,002 | 269,718.33 | 259,001.97 |
| Jun-23 | 96.3% | 96.4% | 94.4% | 95.9% | 95.2% | 96.6% | 99.6% | 88 | 1,004 | 269,718.33 | 259,853.05 |
| Jul-23 | 96.4% | 96.5% | 94.4% | 96.5% | 94.8% | 96.4% | 99.0% | 88 | 1,008 | 269,718.33 | 260,081.53 |
| Aug-23 | 96.5% | 96.4% | 97.0% | 95.9% | 95.0% | 97.0% | 99.9% | 88 | 1,010 | 269,739.49 | 260,206.18 |
| Sep-23 | 96.6% | 96.6% | 97.0% | 96.3% | 95.0% | 97.3% | 99.6% | 88 | 1,011 | 269,739.50 | 260,689.69 |
| Oct-23 | 96.8% | 96.7% | 100.0% | 96.2% | 96.0% | 97.1% | 99.5% | 88 | 1,008 | 269,114.17 | 260,512.68 |
| By Asset Type | By Area | No. Of Assets | No. Of Tenants | Leasable Area (m²) |
Leased Area (m²) |
||||||
|---|---|---|---|---|---|---|---|---|---|---|---|
| Total | Office (O) | Other (Z) | Central Tokyo | Tokyo Metropolitan Area | Four Major Regional Cities | Other Regional Cities | |||||
| Nov-22 | 96.3% | 96.4% | 94.4% | 97.1% | 94.2% | 95.7% | 98.8% | 87 | 960 | 266,844.72 | 258,922.40 |
| Dec-22 | 96.4% | 96.5% | 94.4% | 97.4% | 94.2% | 95.3% | 98.8% | 86 | 952 | 263,340.53 | 253,893.74 |
| Jan-23 | 96.3% | 96.3% | 94.4% | 97.1% | 93.5% | 96.0% | 98.8% | 88 | 994 | 269,701.05 | 259,596.00 |
| Feb-23 | 96.2% | 96.2% | 94.4% | 96.7% | 93.9% | 95.7% | 99.1% | 88 | 996 | 269,700.94 | 259,362.66 |
| Mar-23 | 96.2% | 96.3% | 94.4% | 96.6% | 94.5% | 95.8% | 99.1% | 88 | 998 | 269,700.94 | 259,551.15 |
| Apr-23 | 95.9% | 96.0% | 94.4% | 95.7% | 94.3% | 96.1% | 99.4% | 88 | 998 | 269,700.00 | 258,700.00 |
| By Asset Type | By Area | No. Of Assets | No. Of Tenants | Leasable Area (m²) |
Leased Area (m²) |
||||||
|---|---|---|---|---|---|---|---|---|---|---|---|
| Total | Office (O) | Other (Z) | Central Tokyo | Tokyo Metropolitan Area | Four Major Regional Cities | Other Regional Cities | |||||
| May-22 | 94.7% | 95.6% | 70.6% | 94.2% | 95.1% | 97.5% | 92.2% | 85 | 923 | 263,965.72 | 250,103.30 |
| Jun-22 | 95.6% | 95.6% | 94.4% | 94.2% | 95.1% | 97.8% | 98.0% | 86 | 930 | 266,730.31 | 254,861.97 |
| Jul-22 | 95.8% | 95.8% | 94.4% | 94.8% | 95.1% | 97.4% | 98.3% | 86 | 932 | 266,730.31 | 255,516.62 |
| Aug-22 | 96.2% | 96.2% | 94.4% | 96.1% | 94.6% | 97.3% | 97.9% | 86 | 932 | 266,772.45 | 256,560.76 |
| Sep-22 | 96.3% | 96.4% | 94.4% | 96.2% | 94.6% | 97.3% | 98.7% | 86 | 936 | 266,792.35 | 256,926.02 |
| Oct-22 | 96.5% | 96.6% | 94.4% | 97.1% | 94.2% | 96.7% | 98.8% | 86 | 938 | 266,866.48 | 257,510.25 |
| By Asset Type | By Area | No. Of Assets | No. Of Tenants | Leasable Area (m²) |
Leased Area (m²) |
||||||
|---|---|---|---|---|---|---|---|---|---|---|---|
| Total | Office (O) | Other (Z) | Central Tokyo | Tokyo Metropolitan Area | Four Major Regional Cities | Other Regional Cities | |||||
| Nov-21 | 94.6% | 96.2% | 53.5% | 94.7% | 95.9% | 97.3% | 88.8% | 86 | 927 | 264,709.09 | 250,544.23 |
| Dec-21 | 94.9% | 96.5% | 53.5% | 95.3% | 95.9% | 97.3% | 88.8% | 86 | 928 | 264,709.07 | 251,312.42 |
| Jan-22 | 95.8% | 96.8% | 69.6% | 96.0% | 96.0% | 97.4% | 93.0% | 86 | 934 | 264,709.07 | 253,663.78 |
| Feb-22 | 95.4% | 96.3% | 69.6% | 94.9% | 96.2% | 97.3% | 93.0% | 85 | 923 | 264,027.08 | 251,848.16 |
| Mar-22 | 94.8% | 95.7% | 70.6% | 93.7% | 96.2% | 96.9% | 93.0% | 85 | 919 | 264,004.53 | 250,206.65 |
| Apr-22 | 94.7% | 95.6% | 70.6% | 94.0% | 95.3% | 97.5% | 92.2% | 85 | 923 | 263,948.70 | 249,947.13 |
| By Asset Type | By Area | No. Of Assets | No. Of Tenants | Leasable Area (m²) |
Leased Area (m²) |
||||||
|---|---|---|---|---|---|---|---|---|---|---|---|
| Total | Office (O) | Other (Z) | Central Tokyo | Tokyo Metropolitan Area | Four Major Regional Cities | Other Regional Cities | |||||
| May-21 | 97.1% | 97.2% | 94.4% | 95.3% | 97.8% | 99.1% | 98.8% | 86 | 932 | 264,637.51 | 256,846.16 |
| Jun-21 | 97.0% | 97.1% | 94.4% | 95.4% | 97.5% | 99.1% | 98.8% | 86 | 932 | 264,637.51 | 256,818.60 |
| Jul-21 | 97.0% | 97.1% | 94.4% | 95.4% | 97.7% | 98.7% | 99.0% | 86 | 934 | 264,638.61 | 256,824.85 |
| Aug-21 | 97.3% | 97.4% | 94.4% | 95.8% | 97.7% | 98.7% | 99.2% | 86 | 937 | 264,640.26 | 257,413.07 |
| Sep-21 | 96.7% | 96.8% | 94.4% | 95.4% | 96.1% | 98.9% | 99.2% | 86 | 931 | 264,685.73 | 255,928.33 |
| Oct-21 | 95.4% | 96.9% | 53.5% | 95.4% | 96.7% | 98.6% | 88.8% | 86 | 930 | 264,701.15 | 252,518.19 |
| By Asset Type | By Area | No. Of Assets | No. Of Tenants | Leasable Area (m²) |
Leased Area (m²) |
||||||
|---|---|---|---|---|---|---|---|---|---|---|---|
| Total | Office (O) | Other (Z) | Central Tokyo | Tokyo Metropolitan Area | Four Major Regional Cities | Other Regional Cities | |||||
| Nov-20 | 96.7% | 96.8% | 94.4% | 95.9% | 98.1% | 95.5% | 98.6% | 85 | 919 | 259,812.21 | 251,231.00 |
| Dec-20 | 96.6% | 96.7% | 94.4% | 94.9% | 98.2% | 96.9% | 98.6% | 86 | 933 | 264,691.99 | 255,633.48 |
| Jan-21 | 97.0% | 97.1% | 94.4% | 95.0% | 98.2% | 98.7% | 98.6% | 86 | 934 | 264,650.55 | 256,622.79 |
| Feb-21 | 97.4% | 97.5% | 94.4% | 96.1% | 98.1% | 99.3% | 98.1% | 86 | 937 | 264,650.55 | 257,827.17 |
| Mar-21 | 97.2% | 97.3% | 94.4% | 95.4% | 97.8% | 99.4% | 98.8% | 86 | 933 | 264,651.68 | 257,157.09 |
| Apr-21 | 97.2% | 97.3% | 94.4% | 95.5% | 98.0% | 99.2% | 98.5% | 86 | 934 | 264,651.68 | 257,252.06 |
| By Asset Type | By Area | No. Of Assets | No. Of Tenants | Leasable Area (m²) |
Leased Area (m²) |
||||||
|---|---|---|---|---|---|---|---|---|---|---|---|
| Total | Office (O) | Other (Z) | Central Tokyo | Tokyo Metropolitan Area | Four Major Regional Cities | Other Regional Cities | |||||
| May-20 | 99.6% | 99.6% | 100.0% | 99.8% | 99.3% | 99.7% | 99.2% | 85 | 937 | 259,732.64 | 258,703.58 |
| Jun-20 | 99.2% | 99.3% | 94.4% | 99.4% | 98.7% | 99.2% | 99.2% | 85 | 934 | 259,732.64 | 257,536.52 |
| Jul-20 | 98.9% | 99.1% | 94.4% | 99.0% | 98.7% | 99.5% | 98.4% | 85 | 930 | 259,754.33 | 257,012.69 |
| Aug-20 | 97.9% | 98.0% | 94.4% | 98.3% | 98.4% | 95.6% | 98.6% | 85 | 926 | 259,754.33 | 254,231.18 |
| Sep-20 | 97.7% | 97.9% | 94.4% | 98.1% | 98.4% | 95.4% | 98.6% | 85 | 926 | 259,700.00 | 253,800.00 |
| Oct-20 | 97.5% | 97.6% | 94.4% | 97.4% | 98.5% | 95.6% | 98.6% | 85 | 924 | 259,700.00 | 253,100.00 |
| By Asset Type | By Area | No. Of Assets | No. Of Tenants | Leasable Area (m²) |
Leased Area (m²) |
||||||
|---|---|---|---|---|---|---|---|---|---|---|---|
| Total | Office (O) | Other (Z) | Central Tokyo | Tokyo Metropolitan Area | Four Major Regional Cities | Other Regional Cities | |||||
| Nov-19 | 99.4% | 99.3% | 100.0% | 99.4% | 99.9% | 99.3% | 98.6% | 85 | 933 | 266,478.61 | 264,839.08 |
| Dec-19 | 99.1% | 99.0% | 100.0% | 99.1% | 99.3% | 99.1% | 98.6% | 85 | 931 | 266,478.61 | 264,157.16 |
| Jan-20 | 99.0% | 98.9% | 100.0% | 99.2% | 98.4% | 99.1% | 98.9% | 85 | 930 | 266,478.27 | 263,701.18 |
| Feb-20 | 99.4% | 99.3% | 100.0% | 99.4% | 99.3% | 99.3% | 99.3% | 85 | 932 | 266,501.74 | 264,785.84 |
| Mar-20 | 99.5% | 99.5% | 100.0% | 99.6% | 99.3% | 99.7% | 99.5% | 85 | 933 | 266,507.53 | 265,267.04 |
| Apr-20 | 99.6% | 99.6% | 100.0% | 99.8% | 99.5% | 99.7% | 99.2% | 85 | 938 | 259,717.74 | 258,804.44 |
| By Asset Type | By Area | No. Of Assets | No. Of Tenants | Leasable Area (m²) |
Leased Area (m²) |
||||||
|---|---|---|---|---|---|---|---|---|---|---|---|
| Total | Office (O) | Other (Z) | Central Tokyo | Tokyo Metropolitan Area | Four Major Regional Cities | Other Regional Cities | |||||
| May-19 | 99.3% | 99.3% | 100.0% | 99.8% | 99.5% | 98.9% | 97.8% | 85 | 934 | 266,494.83 | 264,628.15 |
| Jun-19 | 99.4% | 99.4% | 100.0% | 99.8% | 99.9% | 99.0% | 97.8% | 85 | 936 | 266,494.83 | 264,884.18 |
| Jul-19 | 99.3% | 99.2% | 100.0% | 99.5% | 99.6% | 99.2% | 97.8% | 85 | 935 | 266,494.83 | 264,503.17 |
| Aug-19 | 99.4% | 99.3% | 100.0% | 99.5% | 99.9% | 99.0% | 98.5% | 85 | 936 | 266,478.51 | 264,803.94 |
| Sep-19 | 99.0% | 99.0% | 100.0% | 98.6% | 99.7% | 99.3% | 98.7% | 85 | 931 | 266,478.61 | 263,934.52 |
| Oct-19 | 99.4% | 99.3% | 100.0% | 99.3% | 99.9% | 99.3% | 98.6% | 85 | 934 | 266,478.61 | 264,801.14 |
| By Asset Type | By Area | No. Of Assets | No. Of Tenants | Leasable Area (m²) |
Leased Area (m²) |
||||||
|---|---|---|---|---|---|---|---|---|---|---|---|
| Total | Office (O) | Other (Z) | Central Tokyo | Tokyo Metropolitan Area | Four Major Regional Cities | Other Regional Cities | |||||
| Nov-18 | 99.1% | 99.0% | 100.0% | 99.4% | 99.4% | 98.6% | 98.3% | 85 | 920 | 263,438.59 | 261,090.93 |
| Dec-18 | 99.3% | 99.2% | 100.0% | 99.6% | 99.9% | 98.6% | 98.3% | 85 | 922 | 264,587.32 | 262,740.31 |
| Jan-19 | 99.4% | 99.3% | 100.0% | 99.7% | 99.9% | 98.6% | 98.3% | 85 | 922 | 264,587.32 | 262,867.55 |
| Feb-19 | 99.3% | 99.3% | 100.0% | 99.8% | 99.9% | 98.6% | 97.8% | 85 | 923 | 264,587.32 | 262,860.48 |
| Mar-19 | 99.4% | 99.4% | 100.0% | 99.8% | 99.9% | 99.2% | 97.8% | 85 | 923 | 264,587.36 | 263,109.12 |
| Apr-19 | 99.3% | 99.3% | 100.0% | 99.8% | 99.9% | 98.9% | 97.5% | 85 | 921 | 264,762.27 | 263,008.25 |
| By Asset Type | By Area | No. Of Assets | No. Of Tenants | Leasable Area (m²) |
Leased Area (m²) |
||||||
|---|---|---|---|---|---|---|---|---|---|---|---|
| Total | Office (O) | Other (Z) | Central Tokyo | Tokyo Metropolitan Area | Four Major Regional Cities | Other Regional Cities | |||||
| May-18 | 98.9% | 98.8% | 99.8% | 99.1% | 98.8% | 98.5% | 98.9% | 84 | 907 | 260,611.12 | 257,734.19 |
| Jun-18 | 98.9% | 98.8% | 99.8% | 99.1% | 98.8% | 98.5% | 98.9% | 84 | 905 | 260,611.12 | 257,638.55 |
| Jul-18 | 99.1% | 99.0% | 100.0% | 99.3% | 99.4% | 98.4% | 98.9% | 84 | 909 | 260,611.12 | 258,287.62 |
| Aug-18 | 99.1% | 99.0% | 100.0% | 99.3% | 99.4% | 98.4% | 98.9% | 84 | 909 | 260,611.12 | 258,287.62 |
| Sep-18 | 99.1% | 99.0% | 100.0% | 99.4% | 99.6% | 97.8% | 98.9% | 85 | 924 | 263,440.28 | 261,137.99 |
| Oct-18 | 99.2% | 99.1% | 100.0% | 99.6% | 99.6% | 97.8% | 98.6% | 85 | 923 | 263,440.38 | 261,250.63 |
| By Asset Type | By Area | No. Of Assets | No. Of Tenants | Leasable Area (m²) |
Leased Area (m²) |
||||||
|---|---|---|---|---|---|---|---|---|---|---|---|
| Total | Office (O) | Other (Z) | Central Tokyo | Tokyo Metropolitan Area | Four Major Regional Cities | Other Regional Cities | |||||
| Nov-17 | 97.9% | 97.9% | 97.7% | 98.6% | 96.5% | 98.4% | 97.7% | 85 | 926 | 262,758.30 | 257,136.31 |
| Dec-17 | 98.1% | 98.1% | 97.8% | 98.8% | 96.7% | 98.5% | 97.8% | 85 | 931 | 262,767.73 | 257,682.93 |
| Jan-18 | 98.4% | 98.5% | 97.5% | 98.7% | 97.9% | 98.7% | 97.8% | 85 | 932 | 262,678.90 | 258,398.77 |
| Feb-18 | 98.4% | 98.5% | 97.8% | 98.8% | 97.9% | 98.9% | 97.8% | 85 | 934 | 262,678.90 | 258,549.06 |
| Mar-18 | 98.8% | 98.8% | 99.3% | 98.8% | 98.6% | 99.2% | 98.9% | 83 | 895 | 256,258.45 | 253,228.26 |
| Apr-18 | 99.0% | 98.9% | 99.8% | 99.2% | 99.0% | 98.4% | 98.9% | 82 | 891 | 255,487.63 | 252,877.70 |
| By Asset Type | By Area | No. Of Assets | No. Of Tenants | Leasable Area (m²) |
Leased Area (m²) |
||||||
|---|---|---|---|---|---|---|---|---|---|---|---|
| Total | Office (O) | Other (Z) | Central Tokyo | Tokyo Metropolitan Area | Four Major Regional Cities | Other Regional Cities | |||||
| May-17 | 98.2% | 98.3% | 97.7% | 97.6% | 99.1% | 99.0% | 97.4% | 85 | 919 | 262,707.10 | 258,055.30 |
| Jun-17 | 98.6% | 98.8% | 97.3% | 98.7% | 99.4% | 97.9% | 97.5% | 85 | 919 | 262,707.10 | 259,027.86 |
| Jul-17 | 98.3% | 98.4% | 97.3% | 98.5% | 98.5% | 97.9% | 97.5% | 85 | 918 | 262,706.91 | 258,135.57 |
| Aug-17 | 98.4% | 98.5% | 97.7% | 98.7% | 98.5% | 98.0% | 97.5% | 85 | 922 | 262,706.00 | 258,457.00 |
| Sep-17 | 98.1% | 98.1% | 97.7% | 98.5% | 97.9% | 98.3% | 97.1% | 85 | 919 | 262,706.91 | 257,701.35 |
| Oct-17 | 98.1% | 98.2% | 97.7% | 99.0% | 97.1% | 98.7% | 96.7% | 85 | 921 | 262,751.74 | 257,751.60 |
| By Asset Type | By Area | No. Of Assets | No. Of Tenants | Leasable Area (m²) |
Leased Area (m²) |
||||||
|---|---|---|---|---|---|---|---|---|---|---|---|
| Total | Office (O) | Other (Z) | Central Tokyo | Tokyo Metropolitan Area | Four Major Regional Cities | Other Regional Cities | |||||
| Nov-16 | 98.1% | 98.5% | 95.9% | 97.9% | 98.8% | 97.2% | 98.7% | 86 | 899 | 258,633.73 | 253,844.83 |
| Dec-16 | 98.1% | 98.6% | 95.0% | 98.0% | 98.7% | 97.1% | 98.4% | 86 | 898 | 258,677.06 | 253,698.36 |
| Jan-17 | 98.1% | 98.7% | 94.5% | 97.8% | 98.9% | 97.3% | 98.4% | 86 | 902 | 258,677.06 | 253,761.95 |
| Feb-17 | 98.3% | 98.7% | 96.0% | 98.3% | 98.9% | 97.2% | 98.5% | 86 | 899 | 258,690.88 | 254,318.64 |
| Mar-17 | 98.2% | 98.3% | 97.3% | 97.9% | 98.9% | 97.4% | 98.1% | 86 | 900 | 258,720.32 | 253,934.04 |
| Apr-17 | 98.6% | 98.5% | 98.7% | 98.4% | 99.5% | 98.4% | 97.4% | 82 | 897 | 253,545.89 | 249,881.01 |
| By Asset Type | By Area | No. Of Assets | No. Of Tenants | Leasable Area (m²) |
Leased Area (m²) |
||||||
|---|---|---|---|---|---|---|---|---|---|---|---|
| Total | Office (O) | Other (Z) | Central Tokyo | Tokyo Metropolitan Area | Four Major Regional Cities | Other Regional Cities | |||||
| May-16 | 96.9% | 97.1% | 95.2% | 95.0% | 99.0% | 96.8% | 98.3% | 86 | 889 | 259,335.69 | 251,260.02 |
| Jun-16 | 96.6% | 96.8% | 95.4% | 94.7% | 98.7% | 96.8% | 97.8% | 86 | 889 | 259,325.74 | 250,626.16 |
| Jul-16 | 96.8% | 96.9% | 96.5% | 95.8% | 98.5% | 95.7% | 97.7% | 86 | 890 | 259,325.74 | 251,061.51 |
| Aug-16 | 96.9% | 97.1% | 95.7% | 96.1% | 98.3% | 95.7% | 97.7% | 86 | 891 | 259,331.69 | 251,252.31 |
| Sep-16 | 97.6% | 98.0% | 95.7% | 97.7% | 98.4% | 95.9% | 98.0% | 85 | 884 | 257,145.14 | 251,097.19 |
| Oct-16 | 98.2% | 98.5% | 96.2% | 98.6% | 98.4% | 96.3% | 98.7% | 85 | 892 | 257,142.35 | 252,453.34 |
| By Asset Type | By Area | No. Of Assets | No. Of Tenants | Leasable Area (m²) |
Leased Area (m²) |
||||||
|---|---|---|---|---|---|---|---|---|---|---|---|
| Total | Office (O) | Other (Z) | Central Tokyo | Tokyo Metropolitan Area | Four Major Regional Cities | Other Regional Cities | |||||
| Nov-15 | 96.2% | 96.0% | 96.9% | 96.1% | 97.2% | 93.8% | 96.0% | 77 | 726 | 227,426.66 | 218,750.86 |
| Dec-15 | 96.0% | 95.8% | 97.0% | 95.6% | 97.2% | 93.8% | 96.0% | 77 | 725 | 227,424.66 | 218,254.82 |
| Jan-16 | 95.9% | 96.0% | 95.6% | 94.3% | 98.0% | 96.0% | 96.6% | 76 | 717 | 223,497.40 | 214,377.11 |
| Feb-16 | 96.5% | 96.4% | 96.8% | 95.2% | 98.2% | 96.0% | 97.2% | 76 | 720 | 223,467.02 | 215,551.51 |
| Mar-16 | 96.7% | 97.0% | 94.9% | 95.1% | 98.9% | 97.3% | 97.0% | 74 | 693 | 219,445.20 | 212,184.87 |
| Apr-16 | 97.3% | 97.4% | 96.3% | 95.9% | 98.9% | 96.9% | 98.3% | 73 | 690 | 217,381.68 | 211,433.14 |
| By Asset Type | By Area | No. Of Assets | No. Of Tenants | Leasable Area (m²) |
Leased Area (m²) |
||||||
|---|---|---|---|---|---|---|---|---|---|---|---|
| Total | Office (O) | Other (Z) | Central Tokyo | Tokyo Metropolitan Area | Four Major Regional Cities | Other Regional Cities | |||||
| May-15 | 96.2% | 96.0% | 97.1% | 96.2% | 95.7% | 97.8% | 96.0% | 76 | 702 | 223,768.75 | 215,204.10 |
| Jun-15 | 96.2% | 95.9% | 97.4% | 96.6% | 95.6% | 97.8% | 95.2% | 76 | 701 | 223,768.40 | 215,212.34 |
| Jul-15 | 96.1% | 95.8% | 97.4% | 96.1% | 95.8% | 97.8% | 95.7% | 76 | 704 | 223,735.20 | 214,977.99 |
| Aug-15 | 96.4% | 96.2% | 97.6% | 96.2% | 96.9% | 97.8% | 95.7% | 76 | 706 | 223,733.66 | 215,760.01 |
| Sep-15 | 96.2% | 96.0% | 97.0% | 96.4% | 96.8% | 93.8% | 95.7% | 77 | 718 | 227,424.66 | 218,729.25 |
| Oct-15 | 96.2% | 96.0% | 97.4% | 96.5% | 96.9% | 93.8% | 95.7% | 77 | 724 | 227,424.66 | 218,823.32 |
| By Asset Type | By Area | No. Of Assets | No. Of Tenants | Leasable Area (m²) |
Leased Area (m²) |
|||||||
|---|---|---|---|---|---|---|---|---|---|---|---|---|
| Total | Office (O) | Residence (R) | Other (Z) | Central Tokyo | Tokyo Metropolitan Area | Four Major Regional Cities | Other Regional Cities | |||||
| Nov-14 | 95.8% | 95.9% | 97.9% | 93.4% | 96.8% | 95.2% | 95.8% | 94.5% | 70 | 517 | 170,303.59 | 163,217.32 |
| Dec-14 | 96.1% | 96.4% | - | 94.9% | 96.9% | 96.2% | 93.6% | 96.1% | 64 | 610 | 182,236.52 | 175,063.40 |
| Jan-15 | 96.2% | 96.5% | - | 95.3% | 97.9% | 95.4% | 93.6% | 96.1% | 66 | 621 | 187,320.58 | 180,196.39 |
| Feb-15 | 96.0% | 96.0% | - | 96.2% | 97.0% | 96.0% | 94.0% | 95.7% | 66 | 620 | 187,320.58 | 179,876.17 |
| Mar-15 | 96.0% | 96.0% | - | 96.2% | 96.6% | 96.3% | 94.0% | 96.0% | 65 | 605 | 184,943.98 | 177,628.01 |
| Apr-15 | 96.0% | 96.1% | - | 96.0% | 96.8% | 96.0% | 94.8% | 95.7% | 65 | 605 | 184,919.13 | 177,599.70 |
| By Asset Type | By Area | No. Of Assets | No. Of Tenants | Leasable Area (m²) |
Leased Area (m²) |
|||||||
|---|---|---|---|---|---|---|---|---|---|---|---|---|
| Total | Office (O) | Residence (R) | Other (Z) | Central Tokyo | Tokyo Metropolitan Area | Four Major Regional Cities | Other Regional Cities | |||||
| May-14 | 96.2% | 95.8% | 98.0% | 95.8% | 95.4% | 96.2% | 97.8% | 96.4% | 71 | 520 | 170,455.53 | 163,897.97 |
| Jun-14 | 96.1% | 95.6% | 98.3% | 95.8% | 95.2% | 96.2% | 98.1% | 96.2% | 71 | 517 | 170,498.24 | 163,819.71 |
| Jul-14 | 95.5% | 95.0% | 97.2% | 96.2% | 95.0% | 95.8% | 96.8% | 95.3% | 71 | 515 | 170,801.53 | 163,179.03 |
| Aug-14 | 96.0% | 95.6% | 97.2% | 96.2% | 95.8% | 95.6% | 97.6% | 95.3% | 71 | 519 | 170,801.53 | 163,920.50 |
| Sep-14 | 95.7% | 96.0% | 97.8% | 92.3% | 96.3% | 95.2% | 95.0% | 95.5% | 70 | 512 | 170,303.18 | 162,963.96 |
| Oct-14 | 95.7% | 96.2% | 97.0% | 92.3% | 96.2% | 95.1% | 95.8% | 95.3% | 70 | 513 | 170,306.22 | 162,963.15 |
| By Asset Type | By Area | No. Of Assets | No. Of Tenants | Leasable Area (m²) |
Leased Area (m²) |
|||||||
|---|---|---|---|---|---|---|---|---|---|---|---|---|
| Total | Office (O) | Residence (R) | Other (Z) | Central Tokyo | Tokyo Metropolitan Area | Four Major Regional Cities | Other Regional Cities | |||||
| Nov-13 | 95.0% | 94.4% | 97.9% | 94.3% | 95.0% | 94.6% | 98.5% | 92.2% | 68 | 494 | 167,866.93 | 159,483.51 |
| Dec-13 | 95.0% | 94.3% | 97.9% | 94.9% | 94.8% | 95.1% | 98.2% | 92.2% | 72 | 517 | 176,278.09 | 167,376.93 |
| Jan-14 | 95.0% | 95.1% | 94.6% | 94.9% | 93.9% | 95.1% | 98.2% | 94.9% | 72 | 520 | 175,965.36 | 167,176.41 |
| Feb-14 | 95.3% | 95.1% | 96.7% | 94.9% | 94.3% | 94.9% | 98.2% | 95.8% | 72 | 523 | 175,965.36 | 167,696.61 |
| Mar-14 | 95.8% | 95.5% | 97.7% | 94.9% | 94.9% | 94.9% | 99.2% | 96.0% | 72 | 525 | 175,965.34 | 168,530.54 |
| Apr-14 | 96.0% | 95.5% | 97.9% | 96.2% | 95.0% | 96.0% | 98.1% | 96.4% | 71 | 520 | 170,445.35 | 163,628.10 |
| By Asset Type | By Area | No. Of Assets | No. Of Tenants | Leasable Area (m²) |
Leased Area (m²) |
|||||||
|---|---|---|---|---|---|---|---|---|---|---|---|---|
| Total | Office (O) | Residence (R) | Other (Z) | Central Tokyo | Tokyo Metropolitan Area | Four Major Regional Cities | Other Regional Cities | |||||
| May-13 | 95.1% | 94.0% | 99.1% | 95.4% | 94.5% | 96.0% | 98.8% | 92.5% | 66 | 488 | 156,454.99 | 148,843.16 |
| Jun-13 | 94.8% | 93.6% | 99.3% | 95.7% | 93.4% | 95.8% | 98.9% | 93.3% | 69 | 499 | 170,168.49 | 161,351.59 |
| Jul-13 | 94.9% | 93.8% | 99.0% | 95.7% | 94.2% | 95.1% | 98.5% | 93.3% | 69 | 508 | 170,055.93 | 161,452.84 |
| Aug-13 | 95.4% | 94.6% | 98.6% | 95.7% | 95.2% | 95.5% | 98.5% | 92.9% | 69 | 509 | 170,055.93 | 162,221.20 |
| Sep-13 | 94.8% | 93.9% | 98.2% | 95.7% | 94.1% | 95.4% | 98.5% | 92.4% | 68 | 501 | 167,869.53 | 159,222.85 |
| Oct-13 | 95.2% | 94.7% | 98.0% | 94.5% | 95.4% | 94.7% | 98.5% | 92.4% | 68 | 497 | 167,869.53 | 159,843.01 |
| By Asset Type | By Area | No. Of Assets | No. Of Tenants | Leasable Area (m²) |
Leased Area (m²) |
|||||||
|---|---|---|---|---|---|---|---|---|---|---|---|---|
| Total | Office (O) | Residence (R) | Other (Z) | Central Tokyo | Tokyo Metropolitan Area | Four Major Regional Cities | Other Regional Cities | |||||
| Nov-12 | 94.1% | 93.1% | 96.9% | 95.5% | 95.3% | 93.7% | 98.0% | 88.6% | 66 | 491 | 156,480.24 | 147,278.36 |
| Dec-12 | 94.4% | 93.5% | 97.3% | 95.3% | 95.6% | 94.6% | 98.0% | 88.6% | 66 | 490 | 156,480.24 | 147,735.40 |
| Jan-13 | 94.1% | 92.8% | 98.1% | 95.7% | 93.9% | 94.9% | 100.0% | 88.60% | 66 | 489 | 156,498.60 | 147,266.27 |
| Feb-13 | 94.6% | 93.4% | 98.5% | 95.7% | 94.2% | 95.1% | 100.0% | 90.20% | 66 | 490 | 156,498.59 | 148,037.32 |
| Mar-13 | 95.3% | 94.3% | 98.9% | 95.7% | 95.0% | 95.4% | 100.0% | 91.9% | 66 | 494 | 156,453.24 | 149,112.32 |
| Apr-13 | 95.6% | 95.1% | 98.2% | 94.6% | 95.4% | 95.7% | 99.5% | 92.5% | 66 | 492 | 156,494.30 | 149,557.99 |
| By Asset Type | By Area | No. Of Assets | No. Of Tenants | Leasable Area (m²) |
Leased Area (m²) |
|||||||
|---|---|---|---|---|---|---|---|---|---|---|---|---|
| Total | Office (O) | Residence (R) | Other (Z) | Central Tokyo | Tokyo Metropolitan Area | Four Major Regional Cities | Other Regional Cities | |||||
| May-12 | 94.4% | 92.9% | 98.1% | 97.6% | 97.4% | 94.3% | 95.5% | 88.3% | 67 | 515 | 162,508.78 | 153,384.05 |
| Jun-12 | 93.9% | 92.3% | 98.0% | 97.6% | 97.1% | 94.4% | 98.9% | 84.4% | 66 | 504 | 160,539.06 | 150,812.99 |
| Jul-12 | 93.0% | 90.8% | 98.0% | 97.9% | 96.7% | 94.6% | 98.9% | 80.4% | 66 | 503 | 160,420.87 | 149,131.81 |
| Aug-12 | 93.4% | 91.3% | 97.8% | 99.2% | 96.2% | 96.4% | 99.4% | 80.9% | 67 | 505 | 162,925.28 | 152,207.94 |
| Sep-12 | 92.7% | 90.4% | 97.7% | 99.0% | 95.2% | 95.3% | 99.4% | 80.7% | 67 | 501 | 162,676.51 | 150,816.81 |
| Oct-12 | 92.3% | 90.5% | 96.3% | 97.4% | 95.0% | 94.6% | 98.0% | 81.1% | 67 | 503 | 162,676.51 | 150,200.95 |
| By Asset Type | By Area | No. Of Assets | No. Of Tenants | Leasable Area (m²) |
Leased Area (m²) |
|||||||
|---|---|---|---|---|---|---|---|---|---|---|---|---|
| Total | Office (O) | Residence (R) | Other (Z) | Central Tokyo | Tokyo Metropolitan Area | Four Major Regional Cities | Other Regional Cities | |||||
| Nov-11 | 92.1% | 90.6% | 97.6% | 93.9% | 96.4% | 93.4% | 91.3% | 85.9% | 71 | 559 | 175,759.96 | 161,831.04 |
| Dec-12 | 92.6% | 91.2% | 98.0% | 93.7% | 97.3% | 94.1% | 92.1% | 85.6% | 71 | 563 | 175,732.66 | 162,716.88 |
| Jan-12 | 91.8% | 90.0% | 98.3% | 93.7% | 97.0% | 90.2% | 92.6% | 85.8% | 71 | 564 | 175,743.79 | 161,287.64 |
| Feb-12 | 93.0% | 90.9% | 98.6% | 97.9% | 97.4% | 90.9% | 95.4% | 86.6% | 69 | 542 | 167,617.89 | 155,886.77 |
| May-12 | 93.9% | 91.9% | 98.7% | 98.1% | 97.4% | 92.4% | 95.5% | 87.9% | 67 | 518 | 162,635.04 | 152,634.41 |
| Apr-13 | 94.7% | 93.2% | 98.3% | 98.1% | 98.2% | 94.7% | 95.9% | 87.7% | 67 | 520 | 162,565.82 | 153,944.88 |
- (Note 1) The above figures and information have not been audited.
- (Note 2) Leasable Area is the total space of individual properties which are available to be leased, and is subject to minor adjustments due to refurbishing or rental contract terms.
- (Note 3) “Central Tokyo” refers to Chiyoda, Minato, Chuo, Shinjuku, Shibuya, and Shinagawa Wards. “Tokyo Metropolitan Area” refers to Tokyo (excluding the aforementioned six wards), Kanagawa, Chiba, and Saitama Prefectures. “Four Major Regional Cities” refers to Osaka, Nagoya, Fukuoka, and Sapporo.
- (Note 4) The figures provided for the most recent month are based on flash data.